New Viz
This data visualization is designed to show physiologic data (oxygen saturation (SpO2), heart rate, and respiratory rate) alongside altitude and the partial pressure of oxygen (pO2), during a trip from sea level to the top of Mauna Kea and back.
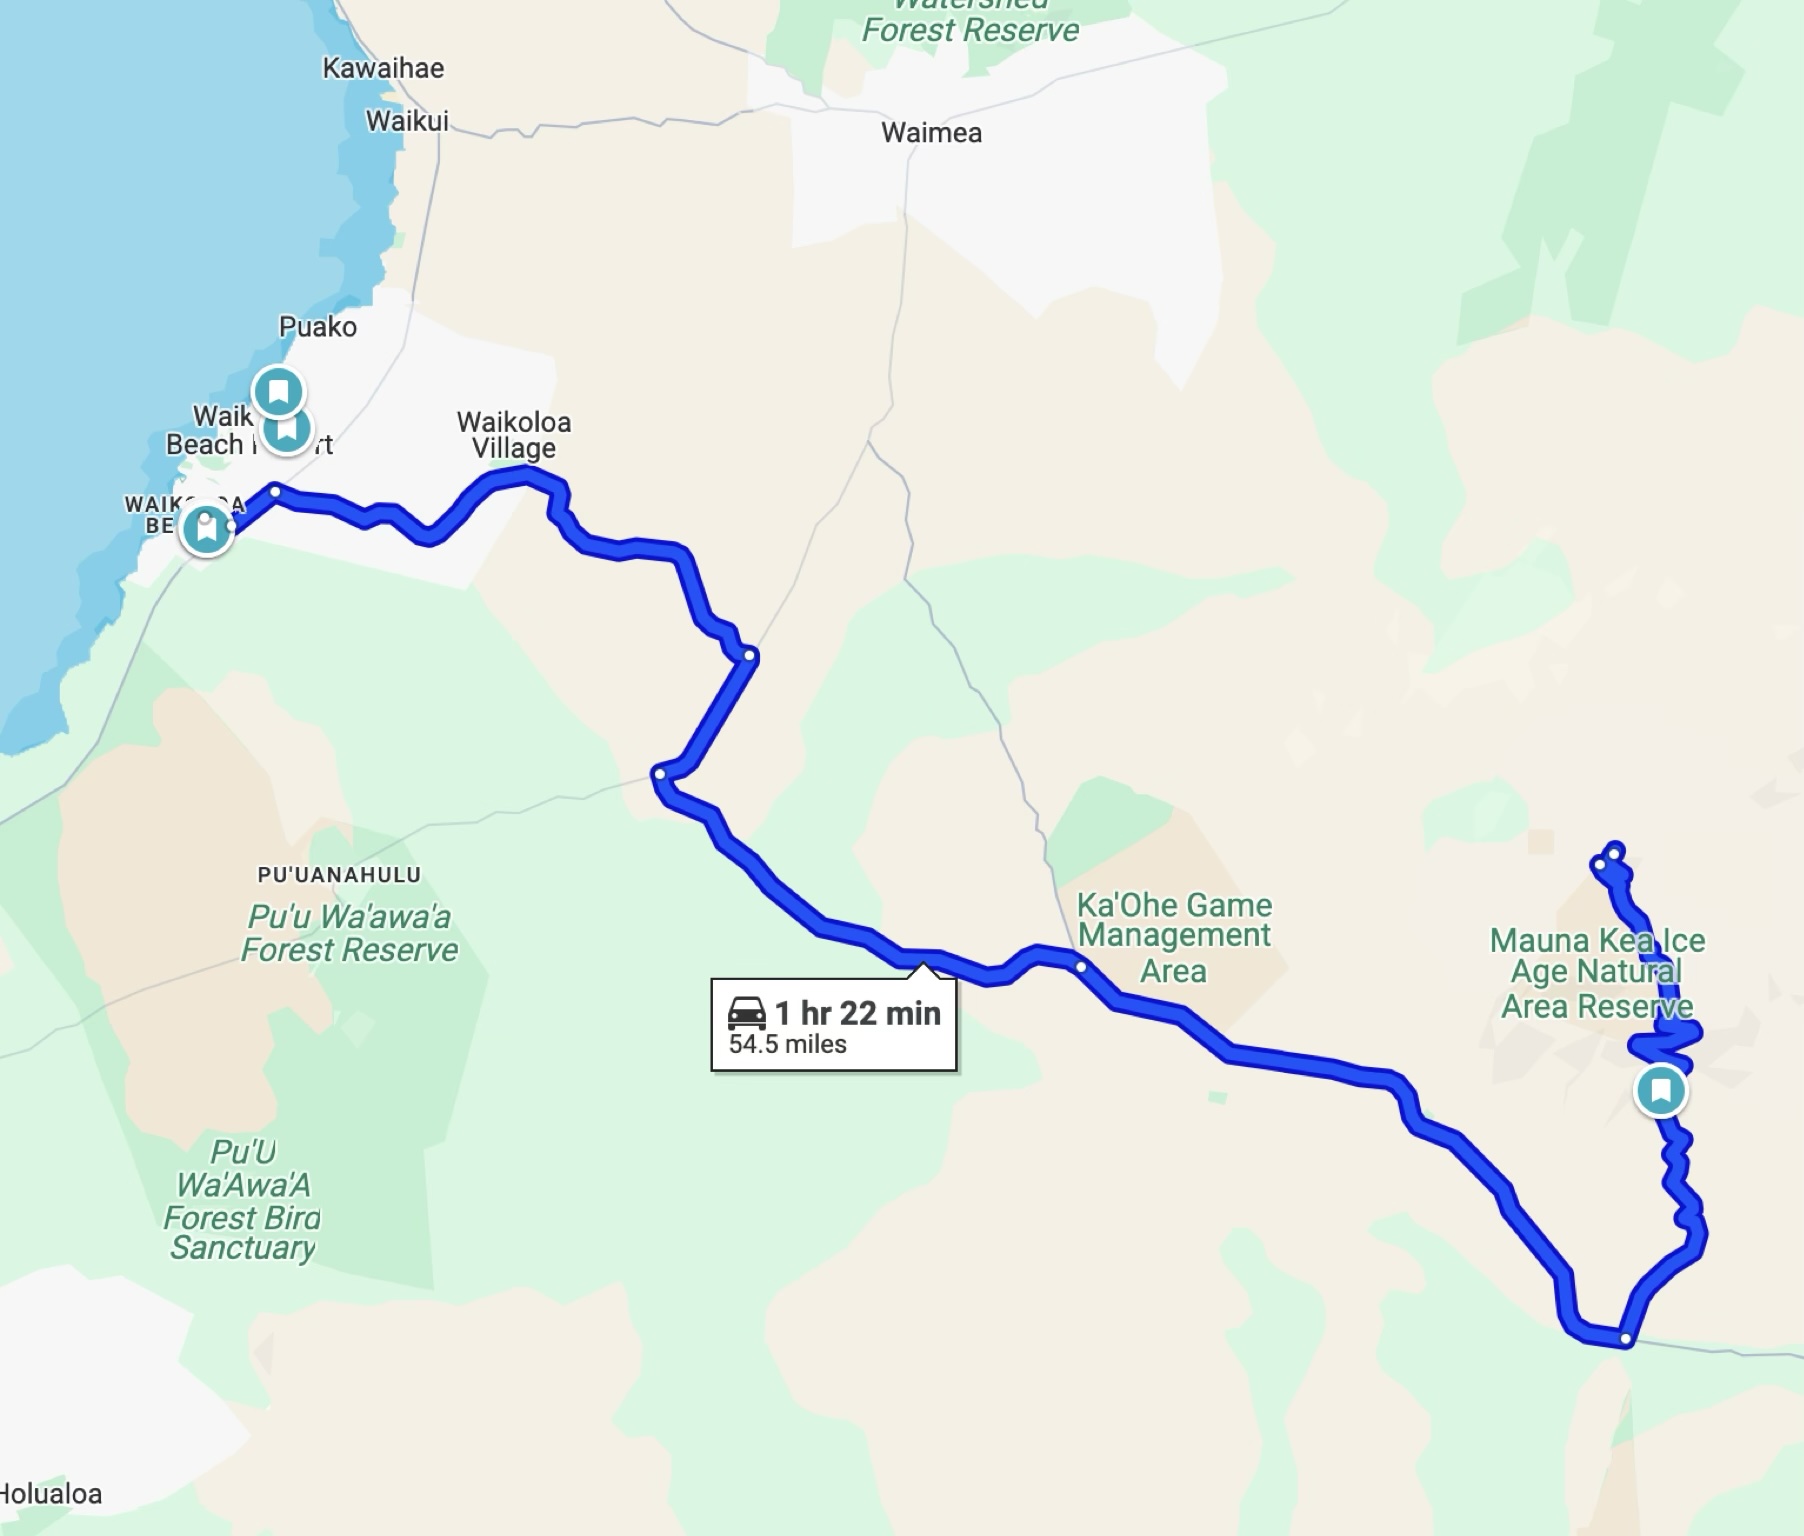
The route, as seen on the map below, started at sea level, and went to 13,895’ altitude over about 2.5 hours (there was a break at the visitors center for acclimitization).
Initial Assessment: A Plot Grid:
using all 5 variables
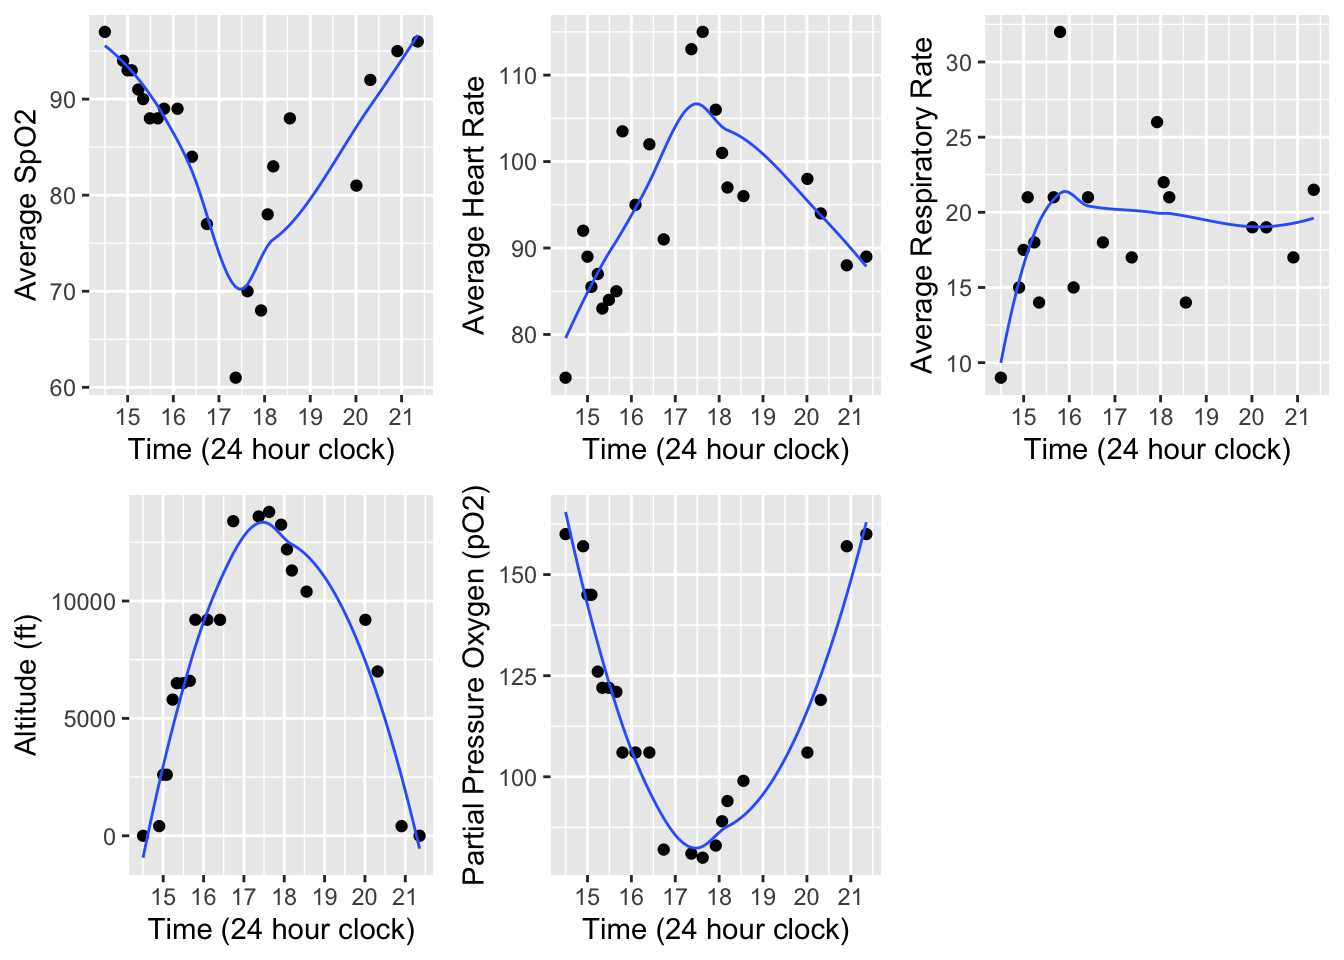
Although you can appreciate the amount of smoothing in this small data set, what is also interesting and somewhat unexpected is that the respiratory rate initially climbs, but then becomes more or less steady through the end of the trip. The SpO2 pattern more or less follows the pO2 pattern, although also of some note, comes back up more quickly. This return towards normal is the beginning of physiologic compensation.
Second Assessment:
emphasis on the SpO2 and pO2
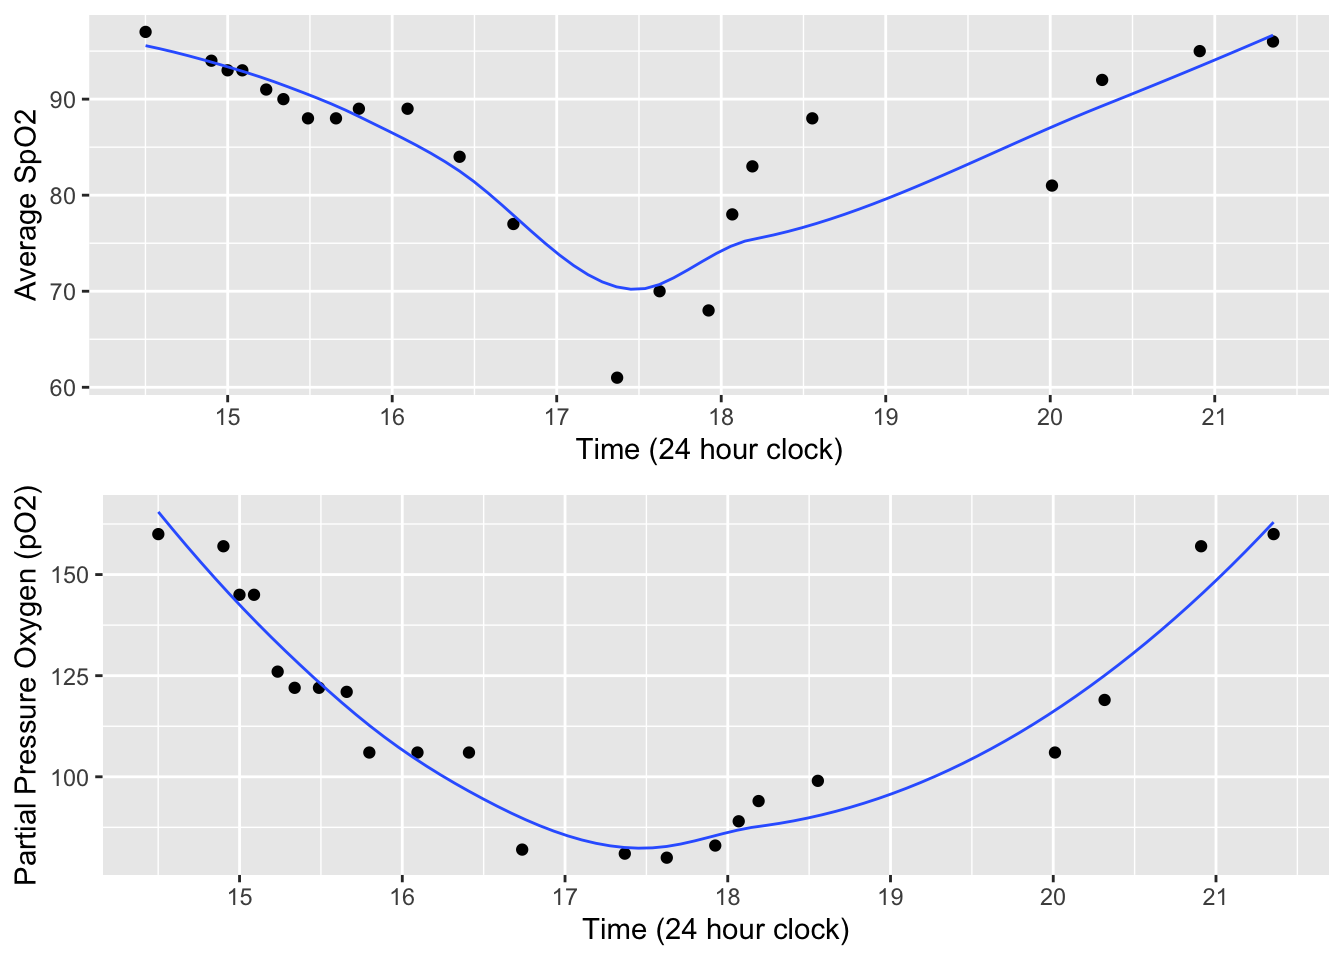
Although both curves decrease and increase more or less at the same time, the initial decrease in SpO2 is slower than pO2. SpO2 drops more after 5pm (above 10,000’ altitude), and then starts to recover faster than the pO2 goes back up. This makes sense physiologically, as the hemoglobin is able to “buffer” the amount of oxygen in the blood stream.
Advanced Plots:
Dual Axis, version 1
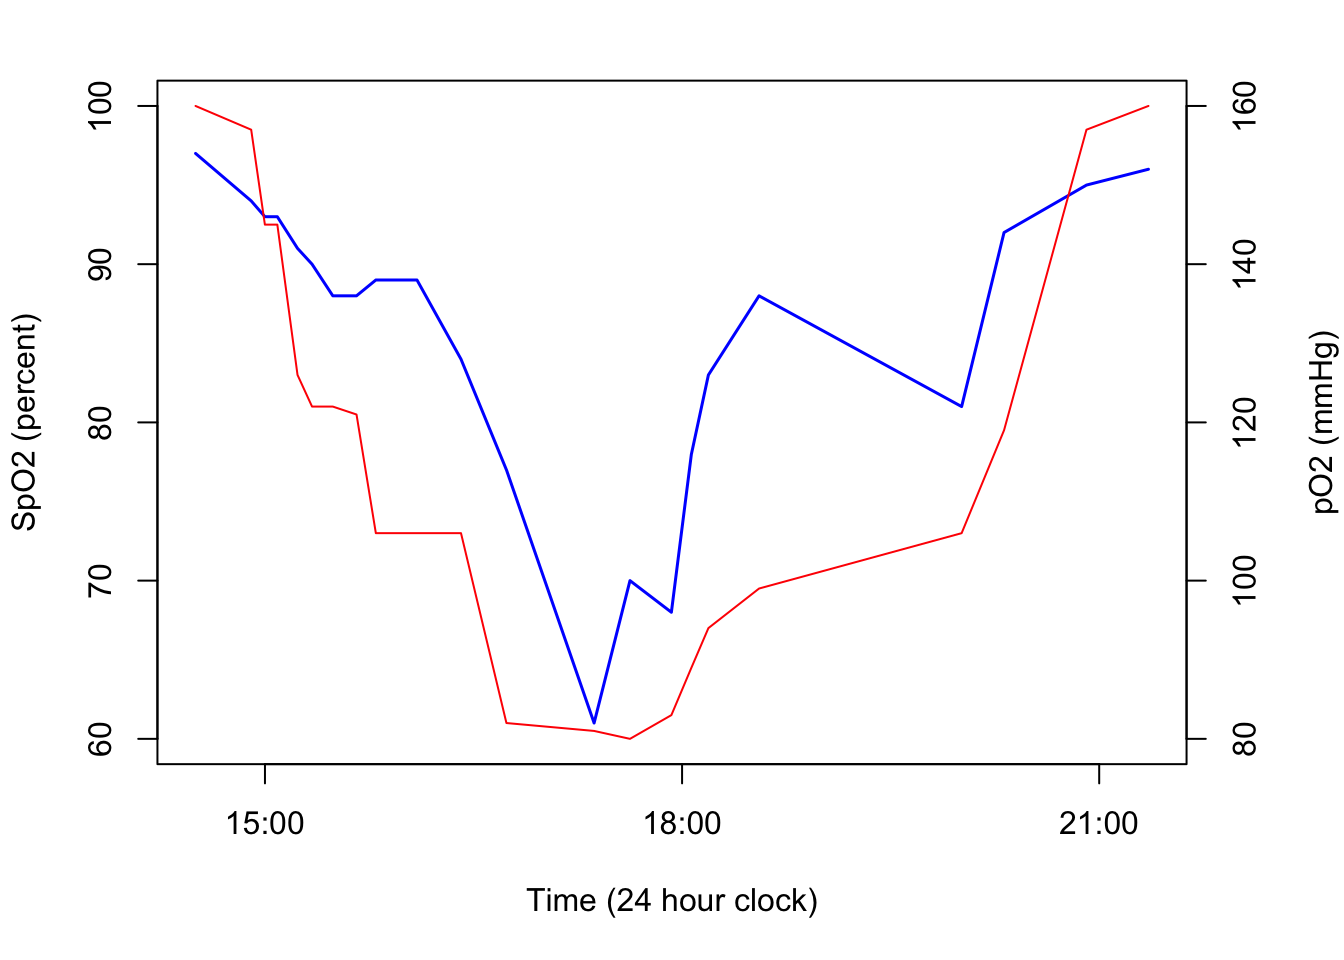
The dual-axis view is useful to see how the changes vary, and again appreciate that there is physiologic buffering. There are some limitations to this visualization, which is created with the base plot functionality within R. Axis scale and tick placement is limited, although you can (and should) set your y-limits for both variables.
Dual Axis, version 2
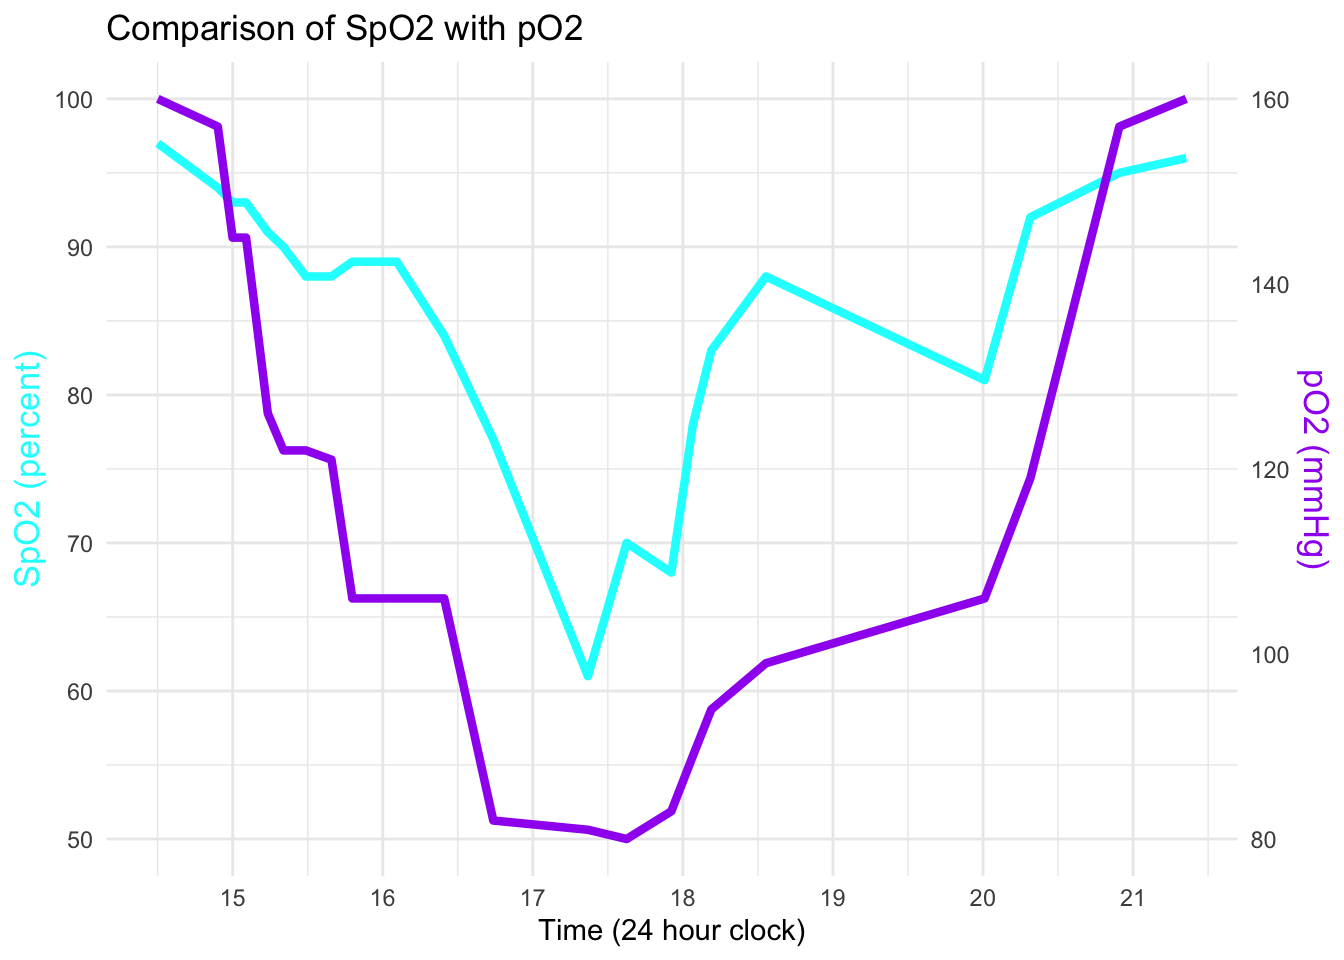
This dual axis view also shows how the changes vary with physiologic buffering. This visualization was created using ggplot2, which allows for the more robust control of the legends, including time selections and tick marks. However, your secondary axis must be mathematically related to the primary axis, and it can take some trial and error to determine the right relationship. In this case, the comparison coefficient is 1.6. The cyan color is the standard color for SpO2 on physiologic monitors in the OR and ICU. There is no standard color for pO2, but purple is also a common color on physiologic monitors.